Overview
Each ObjectStore database application has a unique behavior. Some applications build large data sets that provide regular access for other applications; other applications use the data in predictable ways or query it randomly.
ObjectStore provides several performance controls that you can use to tune the system to meet the varying demands of each application. To tune ObjectStore applications you must:
- Understand how ObjectStore performs when it is used in a given access mode
- Apply ObjectStore's performance controls to optimally match the application's intended usage modes during design and implementation of the application
- Measure the actual performance of the application when it is tested or used in a typical way
- Analyze performance measurements and interpret the results to modify the application program and its use of ObjectStore performance controls
The first two requirements are addressed in the document ObjectStore Performance, which explains the fundamentals of designing and tuning ObjectStore applications for optimal performance.
ObjectStore Performance Expert (OPE) assists you with the last two requirements. OPE helps you get the best performance from ObjectStore by providing performance-relevant data about ObjectStore clients and Servers. It enables you to interactively analyzedata recorded during an application's run.
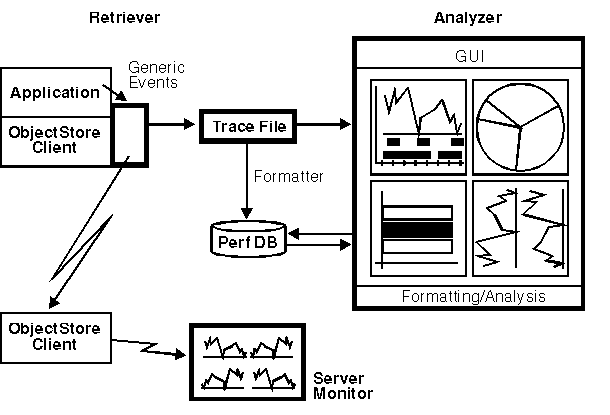
OPE is part of the ObjectStore environment that consists of ObjectStore Servers, ObjectStore clients, and ObjectStore applications, as shown:

The main components of OPE are the OPE Retriever, the OPE Analyzer, and the OPE Server Monitor. They are described in the next sections.
OPE Retriever
you start tracing, ObjectStore loads the Retriever DLL dynamically. Retriever collects raw information on persistent data handling. Optionally, the Retriever collects application-specific data, such as states or locations of the application's processing at any point during performance measurement. The collected data is written into a trace file.
OPE Analyzer
Analyzer reads the trace file, formats it, and creates an ObjectStore performance database.
You can then use the Analyzer to see the following types of performance information, based on the performance database for an application's run:
TimeLine diagram
The main navigation tool. Gives you a bird's-eye view of transactions, boundaries, and all high-level events corresponding to persistent data handling.
Client Counters/Ratios diagram
Gives you statistical information on ObjectStore's persistent data handling for all databases to which your application has access during its run.
ElapsedTime diagram
Shows you in a pie chart the time taken by various categories of events, ObjectStore operations, and OPE.
Storage Counters/Ratios diagram
Shows you the counters and ratios of each ObjectStore storage object (database, segment, and page) to which your application has access during tracing.
PageState diagram
Gives you a detailed view of the application trace based on different storage levels and informs you about paging and locking events.
The diagrams provide you with multiple views of the application's processing. Numerous user interface functions allow you to navigate interactively through graphs and diagrams.
OPE Server Monitor
he Server Monitor measures the performance of an ObjectStore Server. The Server Monitor displays aspects of ObjectStore Servers as diagrams with a number of line graphs. This information is gathered using the public API calls from dbutil.hh; the content is comparable to the ASCII output of the ossvrmtr/ossvrstat tools.
Observing Application Activities
To improve the performance of your application, you must be able to observe the following activities of your application. (These topics are also discussed in Aspects of Database Performance of ObjectStore Performance.)
- Lock acquisition and duration
- Frequency and granularity of disk access
- Pattern of access to persistent data
- Caching and paging patterns
- Transaction boundaries
- Frequency of Server actions such as checkpoints and paging
To achieve this, ObjectStore provides you with the following controls and modes:
- Granularity of disk access
- Disk prefetch policy
- Local cache size and eviction policy
- Lock granularity, acquisition and upgrade policy, and timing
- Transaction type and size
These modes and controls are discussed in Designing and Tuning for Performance of ObjectStore Performance.
OPE assists you in measuring the effect of the ObjectStore performance controls you use in several ways:
It collects information on client and Server database activities and other application parameters during an application's run. It then assembles this information, so you can analyze the data to get a comprehensive picture of your application's process.
OPE presents the results as diagrams that contain graphs and pictures representing different views of the application's performance pattern and give several degrees of detail. You can navigate through these diagrams, scroll, zoom, and select time intervals, to analyze the measured data interactively. Interactive analysis allows you to determine which details you want to see on the diagrams.
The diagrams present you with the following data:
- General application data, such as transaction boundaries and collection activities
- Elapsed time data divided into major categories, such as database open, create, and close; page fetch, allocation, lock upgrade, and eviction; transaction commit and abort
- Counters/ratios values representing high-level summary values, such as number of evictions and number of page fetches for an arbitrary time interval
- States and transitions of pages including lock and cache states of pages containing persistent data
OPE also lets you monitor the performance of any ObjectStore Server in your network. Thus, you get an overview of the Server's workload. You can view data representing resource consumption of your application and the Servers communicating with your application.


