Step 2: Start the Analyzer
Start the Analyzer to view the created trace file by entering
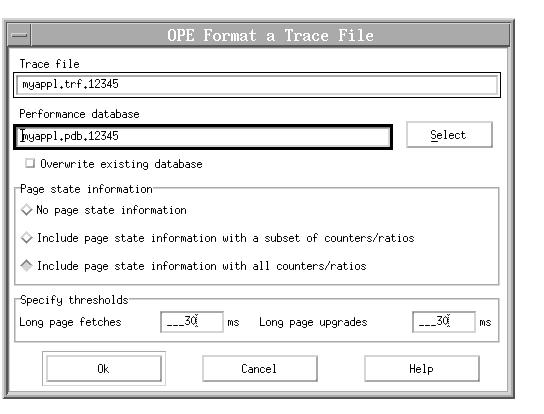
Before you can display the event data from the application run, you must format the trace file into a performance database. Therefore, OPE shows you the following dialog:

- Use the displayed name for the performance database or type in a new name.
- Select Include page state information.
The process is time consuming and uses additional disk space, but as you use OPE for the first time, you get an overview of all kinds of information. As an experienced OPE user, you might exclude page state information to get a quicker overview of the application's processing.
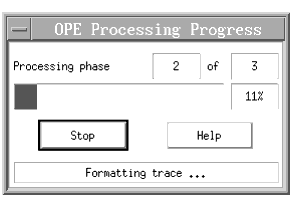
The Processing Progress dialog indicates the current status of formatting with a gauge.

The next section shows you the diagrams and tells you what kind of information you can see.


