TimeLine Diagram
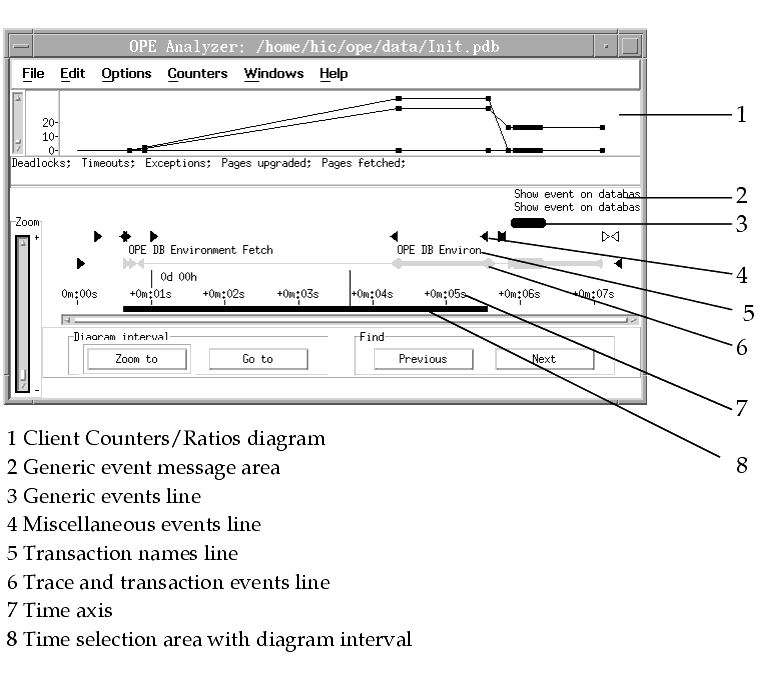
The TimeLine diagram looks like the following:

It consists of the following elements:
- Diagram elements
- Time axis with Time selection area
- Event lines with Trace and transaction events line
- Generic event message area
- Transaction names line
- Client Counters/Ratios diagrams
- Navigation elements
- Horizontal scroll bar
- Vertical zoom box
- Diagram interval box
- Find box
- Status line
- Menu bar
- Pop-up menus
The TimeLine diagram lets you select time intervals of the application trace that are of interest to you. The following section tells you what the TimeLine diagram consists of and how you work with it.


