Event Lines
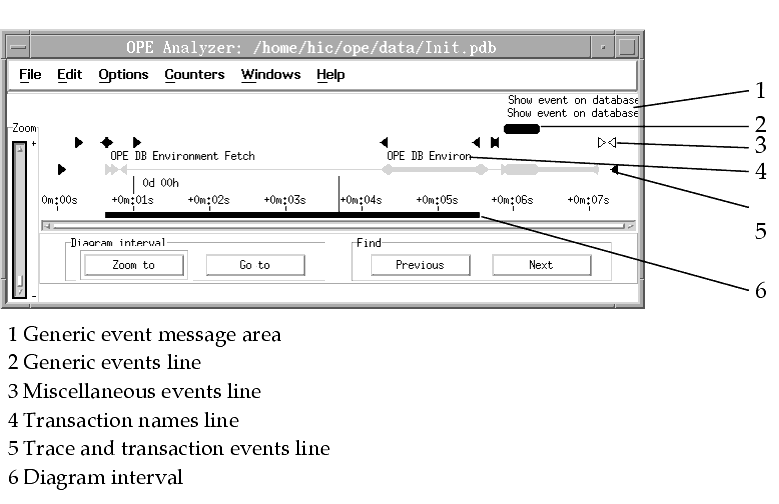
The TimeLine diagram has several event lines showing you important events that occur during tracing of your application. The events correspond to persistent data handling and help you judge the workload of the ObjectStore client.
The following diagram shows you an example of the event lines. Note that the Client Counters/Ratios diagram is not shown in this example.

The event lines are only shown if the corresponding events are selected. Generic events, and trace and transaction events are selected by default. You can select events in the Select Events dialog of the Options menu.
Depending on the zoom level, overlapping events indicated by arrowheads can imply an incorrect time sequence. To see the correct time sequence, zoom in on this part of the diagram interval so that the events no longer overlap each other.
Each line represents a different event category as discussed in the next sections.
Generic Events Line
This line shows you the events raised by your application. You can assign a different color to each generic event type. Generic events are indicated by the following symbols:
Single-event (generated with raise_single method)
![]()
Before-event (generated with raise_before method)
![]()
After-event (generated with raise_after method)
![]()
Trace and Transaction Events Line
This line shows you transaction begin, retry, commit, and abort events. It also shows you trace start and stop, suspend and resume events. These event types are indicated by colored arrowheads. A thin line represents the outermost transaction that is active at the time displayed on the time axis. A thick line represents the period of committing a transaction. An empty bar represents the period of aborting a transaction.
| Transaction begin |
|
| Transaction retry |
|
| Transaction commit |
|
| Transaction abort |
|
| Trace start |
|
| Trace stop |
|
| Trace suspend |
|
| Trace resume |
|
Miscellaneous Events Line
This line shows you different types of events that are indicated by colored squares or arrowheads:
| Client environment change events |
|
Errors during persistent data handling:
Timeout

Deadlock

Exception

Errors
Database before-open

Database after-open

Database before-close

Database after-close

Database events
Note: For database after-open and database before-close only, the name of the database is shown in the status line and in the Database Event Details dialog
.
os_collection::query | query_pick | query_exists( <type>, <expr>)
results in consecutive events, one event for the parsing of the expression and one event for the execution of the query.
When your mouse pointer is on an event indicating an error or an event ending with an error, OPE shows you the reason for the error in the status line. The event details dialog also gives you this information. Depending on the event type, the reason for an error can be deadlock, timeout, or other error.


