Menu Bar
The menu bar contains the following choices:

Each choice has a pull-down menu with options that are described in the following sections:
File
Open
Displays the Open an Application Trace dialog where you specify or select a trace file or a performance database.
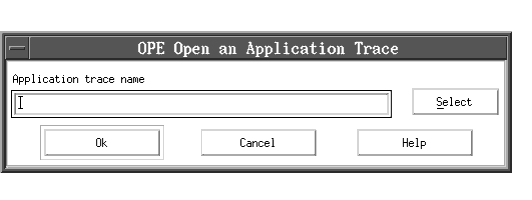
If you select Select, you get the Select Trace dialog where you can choose a trace file or performance database:
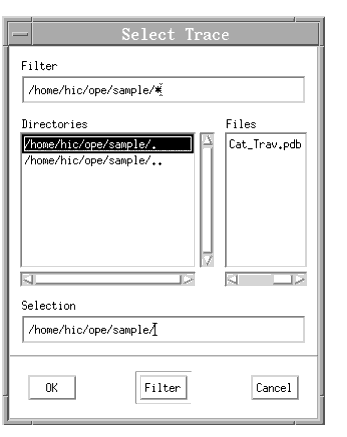
If you specify or select a performance database, OPE reads the trace and immediately displays the following corresponding diagrams:
- Analyzer window with the TimeLine diagram
- Client Counters diagram in the diagram pane of the TimeLine diagram showing the counters selected by default
- ElapsedTime diagram
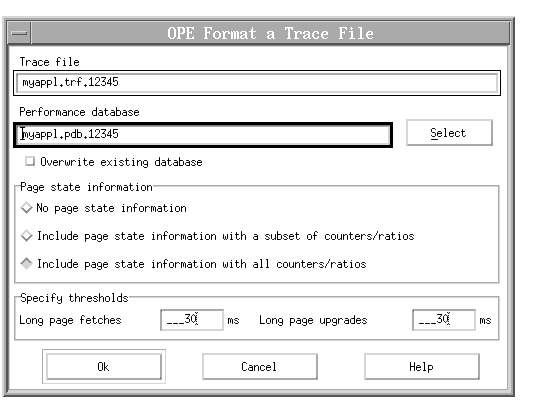
If you specify a trace file, OPE invokes the formatting functions and displays the Format a Trace File dialog.
Note: You cannot format a trace file when one or more performance databases are already displayed. To format a trace file you must close all open performance databases.
If you specify a file name that is neither a trace file nor a performance database, an error is reported.
Defining the application trace names
In the Format a Trace File dialog you start to format the application trace. This section describes how you define the application trace, and what you can select in this dialog:
In the field Trace file the specified application trace is shown. This field is a read-only field.
In the field Performance database you can specify the name of an ObjectStore database where the formatted application trace is to be stored. A performance database can store only one application trace. You can also select an existing database by using the Select button.
If you do not specify a database name, it is assumed that you want to write the performance database to an ObjectStore file database that is located in the same directory as that of the trace file. This file database gets the name of the trace file. If the trace file name contains the token trf, trf is replaced by pdb. If the trace file does not contain the token trf, the performance database gets the name of the trace file with the extension pdb.
Defining other options
- Overwrite existing database
When the formatting step is finished, you can delete the trace file unless you want to repeat the formatting step using different options.
- Include page state information with a subset of counters and ratios
- Include page state information with all counters and ratios
- Specify thresholds
- Long page fetches Use this option to specify the minimum time period for long page fetches in milliseconds. Page fetches exceeding the time period defined are counted by OPE as long page fetches. The default value is 30 milliseconds.
- Long page upgrades Use this option to specify the minimum time period for long page upgrades in milliseconds. Page upgrades exceeding the time period defined are counted by OPE as long page upgrades. The default value is 30 milliseconds.
The setting of Specify thresholds does not affect the storage counters.
When you select OK, a performance database is created. The time that OPE needs for the formatting step can be long, depending on the size of the trace file. The Processing Progress dialog with a gauge indicates the current status of formatting. Select Stop to end the formatting process without creating a performance database.
When the formatting step finishes successfully, the following corresponding diagrams are displayed:
- Analyzer window with the TimeLine diagram
- Client Counters diagram in the diagram pane of the TimeLine diagram showing the counters selected by default
- ElapsedTime diagram
Close
Closes the application trace and displays an empty Analyzer window.
Show details
Displays the Application Trace Details dialog that shows you detailed information on the application trace:
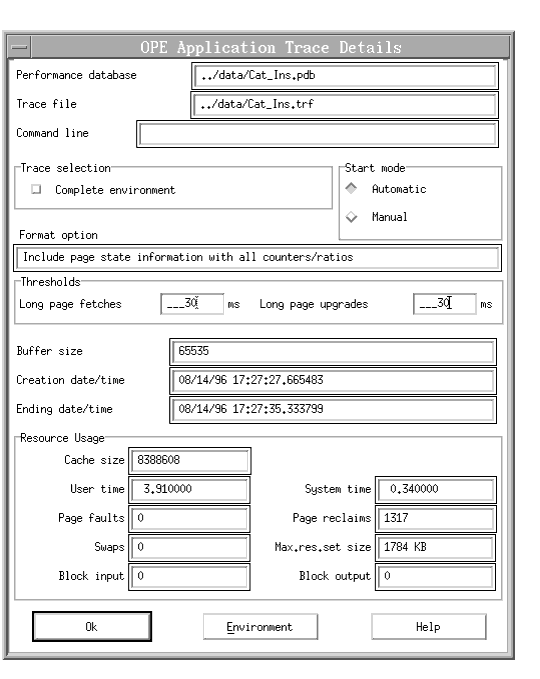
This dialog shows you the following information:
- Performance database
- Trace file
- Command line
- Start mode
- Trace selection
- Buffer size
- Creation date/time
- Ending date/time
- Resource usage
Select Environment to get the Application Trace Environment dialog that shows you detailed information on the environment variables used for your application's run.
The box Thresholds contains the following values:
- Long page fetches
- Long page upgrades
Format option has the following values:
- No page state information
- Include page state information with a subset of counters/ratios
- Include page state information with all counters/ratios
Transaction summary
This option allows you to export statistical information on transactions to a flat ASCII file from which you can examine or process this data. You can, for example, use a spreadsheet program to compute new data on the basis of the exported data or to create your own diagrams.
The resulting transaction summary file contains one line for each ObjectStore transaction that is measured by OPE. The settings of Transaction attributes and Selected counters specify the contents of each line. The first line is a header line providing labels for the values in the consecutive lines.
Specify Transaction Summary dialog
The Specify Transaction Summary dialog looks like the following:
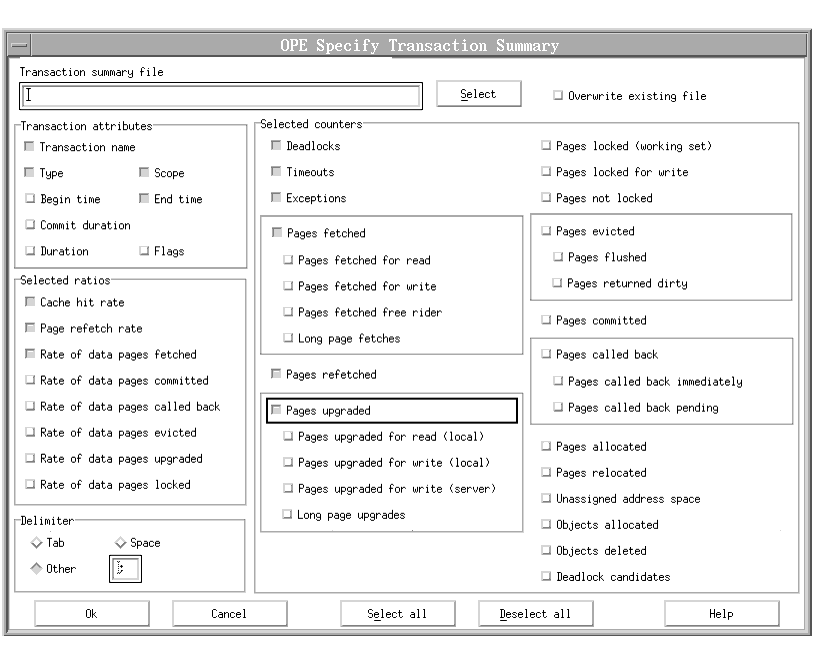
In this dialog you define the following:
In the Transaction summary file field you specify the name of the export file that is to contain the transaction summary data. With Select you get a standard file selection dialog.
Select Overwrite existing file to overwrite an existing transaction summary file.
Attributes
In the Transaction attributes field you can specify the information that OPE writes into the transaction summary file. You can select the following attributes:
In the Selected counters field you specify the client counters that are to be exported to the transaction summary file. Each selected counter applies throughout the complete duration of the transaction. For a detailed description of the valid counters refer to "Client counters".
In the Selected ratios field you specify the client ratios that are to be exported to the transaction summary file. Each selected ratio applies throughout the complete duration of the transaction. For a detailed description of the valid ratios refer to "Client ratios".
In the Delimiter field you can define the character that delimits the values for each line in the transaction summary file. Select Tab, Space, or Other. When you select Other, you can use any character that you can type in from your keyboard.
Exit
When you exit from the Analyzer, all windows are closed. The contents of the profile in memory is written to disk.
List of recently opened performance databases
At the bottom of the File menu, OPE shows you a list of the most recently opened performance databases, up to a maximum of five names. The names are loaded from the profile and appear in chronological order with the most recently opened performance database at the top of the list. To open a listed performance database, select it. The corresponding TimeLine diagram is displayed immediately. When OPE adds a name to the list of five performance database names, it removes the name at the bottom. For more information on the profile see Defining the Control Data.
Edit
Find event
Select Find Event to get the Find Events dialog that helps you find transactions and generic events.
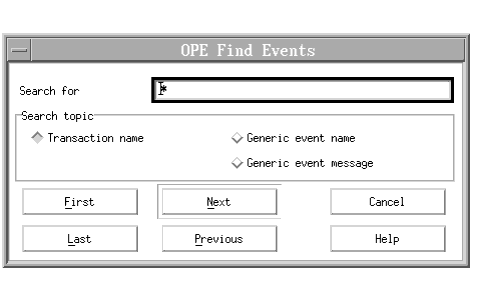
In the field Search for enter a transaction name, a generic event name, or a generic event message. You can enter a partial name starting or ending with an asterisk.
In the field Search topic select Transaction name, Generic event name, or Generic event message.
To start the search, select First, Next, Previous, or Last. For the search process the case of the name does not matter. When an event is found, its name is shown highlighted on the time line. Select Cancel to close the Find dialog.
First, Next, Previous, Last
After OPE finds a transaction beginning or generic event, select First, Next, Previous, or Last to go to other events matching the specified name. For transactions the diagram interval changes and represents the complete transaction that is found.
Zoom to diagram interval
When you select Zoom to diagram interval, the selected diagram interval fills the time interval that you see in the TimeLine diagram. This allows you to view more details.
Go to diagram interval
When you select Go to diagram interval, the beginning of the diagram interval is shown again. This helps you find the diagram interval after you scroll along the time axis and the diagram interval disappears.
Select entire trace
With this entry you can set the diagram interval to span the complete trace.
Options
With Options you can define the information that is shown in the TimeLine diagram.
Relative time
Absolute time
The time indicated on the time axis can be shown as relative or absolute time (for details see Time Axis).
Select events
Displays the Select Events dialog where you can select events to be shown on the event lines of the TimeLine diagram. Note that memory events are only displayed in the PageState diagram.
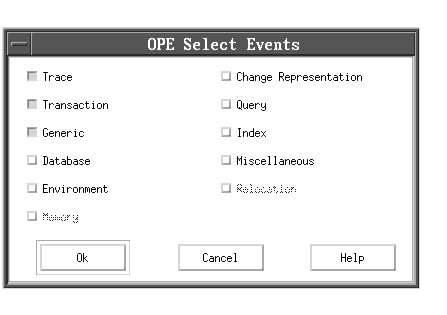
Generic, Trace, and Transaction are selected by default.
Refresh while scrolling
When you select Refresh while scrolling, all diagram elements change automatically while you move along the time axis. When you deselect Refresh while scrolling, the Client Counters/Ratios diagram area is not shown until you release the left mouse button. However, the event lines, the name lines, and the time scale change automatically while you move along the time axis. (See also Horizontal Scroll Bar.)
Deselecting Refresh while scrolling helps you get a steadier view of the diagram. It might also prevent performance problems in case the Client Counters/Ratios diagram contains many elements.
Save profile
Select this option to save the currently used settings to your personal profile.
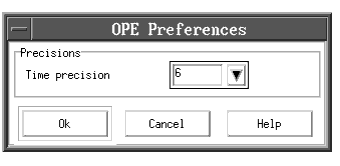
Preferences
This option refers to each time indication in seconds. It displays the Preferences dialog, where you can specify the number of decimal places after the decimal point.
Counters
To create a new Client Counters/Ratios diagram, select one of the following entries:
New client counter graph
Shows you the Select Client Counters dialog where you can select new counters to be displayed.
New client ratio graph
Shows you the Select Client Ratios dialog where you can select new ratios to be displayed.
New client generic event graph
Displays a diagram showing client generic events if they are available (for details refer to Class os_ope_generic_event).
New unassigned address space graph
Displays a diagram showing unassigned address space.
Windows
Select Windows to choose one of the following diagrams:
- Page States
- Elapsed Time
- Storage Counters/Ratios
The diagram type you can display depends on the data in the performance database. If the necessary data is not available and you cannot display the selected diagram, you get an error message. To get the necessary data, include page state information and format the trace file again.
Each diagram is displayed for the selected diagram interval. If you change the diagram interval, OPE changes the ElapsedTime diagram, the PageState diagram, and the Storage Counters/Ratios diagram automatically according to your changes.
To display a new diagram, display the pull-down menu and select a new diagram. If you select a diagram type that is already open, OPE brings this diagram to the front of your screen. If you select a diagram that is minimized, OPE restores it.
When you select Storage Counters/Ratios, OPE shows you the Storage Counters/Ratios diagram with the counter selection that is stored in the profile. For details of profile settings, see Defining the Control Data.
You can open two diagrams of the same type for one application trace. To do this, select Open trace from the File menu. Thus, you can view, for example, two ElapsedTime diagrams for different time intervals of the same application trace.
With this menu you also navigate between the TimeLine windows of the Analyzer. To switch to a desired TimeLine window, click on its name displayed as an entry at the bottom of this menu.
Help
The Help menu contains the following options:


