Server Monitor
The Server Monitor window menu is different depending on whether
- You monitor a server.
- You view a log file (see Log Files for details).
- You neither monitor a server nor view a log file. In this case you get an empty screen. Use the File menu to start monitoring a Server or viewing a log file (see "Monitor Server" and Log Files for details).
While monitoring a Server the Server Monitor diagram contains the following elements:
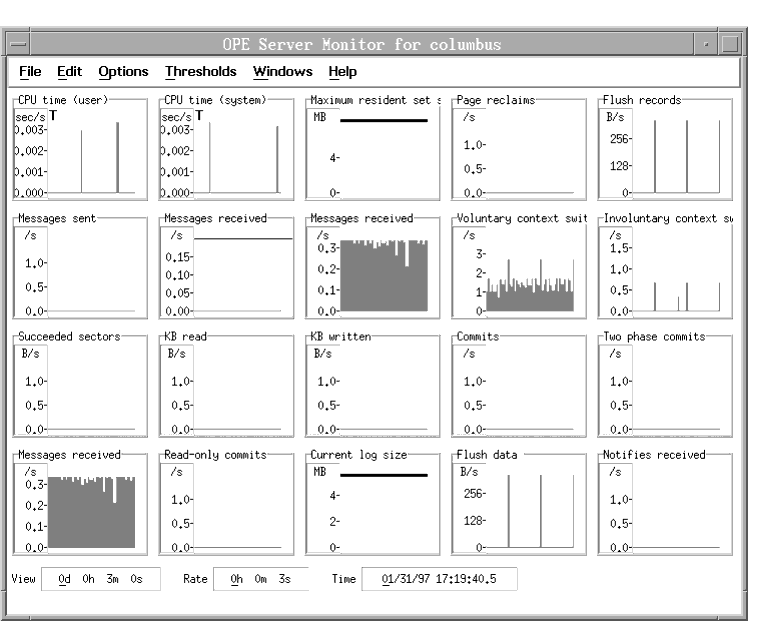
- Diagram pane with different diagrams, each displaying a single Server meter
- View, rate, and time indicator
- Status line
- Menu bar
- Pop-up menus
Diagram Pane
The diagram pane contains several diagrams of the same size depending on the size of the Server Monitor window. The diagrams are shown in cells of a grid. For each grid cell, you can select a diagram to be displayed. The diagrams show you Server meters that are collected by OPE.
When you start the Server Monitor for the first time, you see the diagrams that are selected by default.
To display a new diagram, do one of the following:
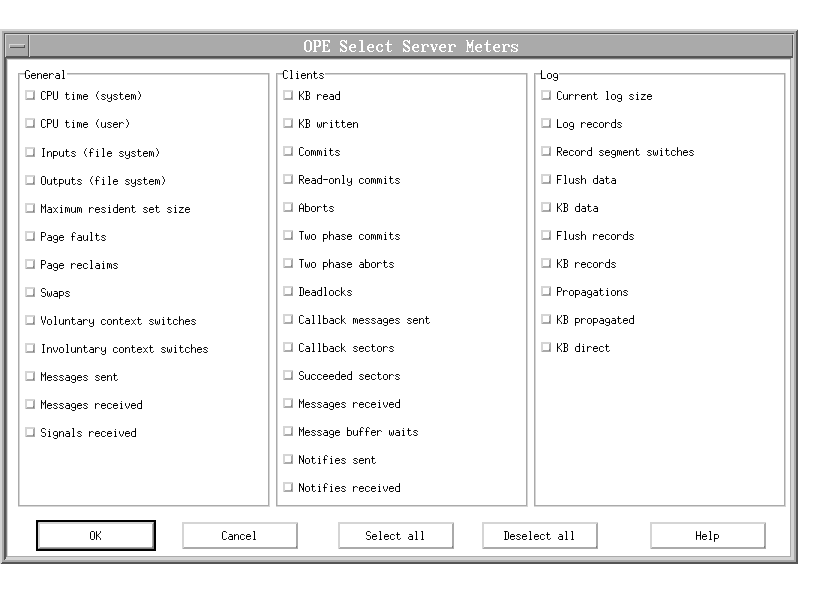
- Select New Server meters from the Options menu. You get the Select Server Meters dialog, where you can select one or more new meters. OPE displays the new meters as diagrams in the empty cells. If the number of selected diagrams exceeds the number of empty cells, you get an error message (for details refer to "New Server meters").
- Place the mouse pointer in an empty cell, invoke the pop-up menu, and select New Server meters. You get the Select Server Meters dialog, where you can select one or more new meters.
Note: You can display the same meter several times.
Status Line
The status line shows you information explaining details on values in the graph. The information depends on the position of the mouse pointer.
- View
- Rate
- Time
- From
- To
- Meter name
- Value
Menu Bar
The menu bar contains the following choices, and each choice is described below:

File
Monitor Server
Select Monitor Server to get the Specify Server Name dialog where you specify the name of the Server that you want to monitor.
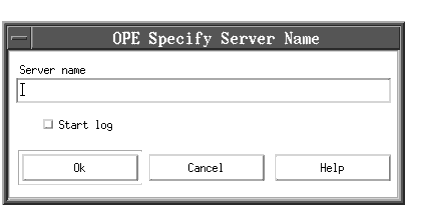
If you specify the Server name that you specified with the start command for the Server Monitor, you get a second Server Monitor window for the same Server. If you specify a different Server name, you get another copy of the Server Monitor for the selected Server.
When you select Start log, you get the Start logging window where you can specify or select a name for the log file. For a detailed description of this window see "Start logging".
Show Server parameters
Select Show Server parameters to get the Server Parameters dialog showing you detailed information on the Server parameters. The Server parameters define some aspects of how the ObjectStore Server works. (For more details refer to ObjectStore Management.) For a detailed description of Server parameters see page 135.
To close the dialog, select OK.
Start logging
With the Start logging option you can tell the Server Monitor to start writing the measurements into a log file.
When you select Start logging OPE prompts you with the following Start logging dialog.
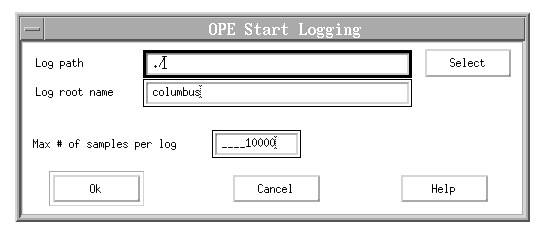
In the Log path field you specify the directory where the log is to be stored. In the Log root name field you specify the logfile_name_root. OPE adds .date.time.sml, for example, .19970224.132216.sml . The Server meters are stored in these log files.
In the field Max # of samples per log you can specify how many samples OPE writes to a log before opening a new log. The default value is 10,000. For detailed information about logging see Log Files.
Stop logging
Select Stop logging to stop the process of storing Server meters in a log file. The current log file is written to disk and closed, even if the specified maximum number of samples has not yet been reached.
Once a log file has been written you can open it and view its contents by following the View log instructions below.
View log
Select View log to get the Select Log dialog where you specify the name of the log file you want to view.
For more details about viewing a log file see Log Files.
Close
Closes the Server Monitor window.
Exit
Select Exit to close the current Server Monitor and all its open windows.The content of the profile in memory is written to disk.
List of recently monitored Servers
At the bottom of the File menu, OPE shows you a list of the recently monitored Servers, up to a maximum of five names. The names are loaded from the profile and appear in chronological order with the most recently monitored Server at the top of the list. To open the Server Monitor for a Server listed, select it. The corresponding Server Monitor window is then displayed immediately. When OPE adds a name to the list of five Server names, it removes the name at the bottom.
Edit
Freeze display
Select Freeze display to stop further screen updates. Note that OPE still collects data continuously but displays it on the screen only when you select Unfreeze display. This gives you a static picture of the Server meters.
Unfreeze display
Select Unfreeze display to continue with screen updates and to see the current state of the Server meters. The values that are measured during the freeze period are included.
Options
New Server meters
Select New Server meters to get the Select Server Meters dialog where you can select one or more new Server meters to be displayed. To confirm your selection, select OK. If the number of selected diagrams exceeds the number of empty cells, you get an error message. Reduce the number of new Server meters or define new empty cells by changing the grid size.
Layout
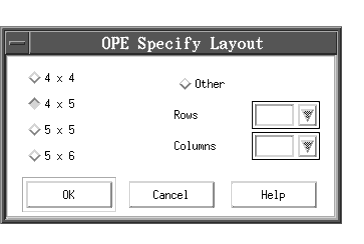
Select Layout to define the size of the grid in which OPE displays the diagrams and to change the number of rows and columns. The Layout function provides you with the Specify Layout dialog that shows grid sizes that you can change. When you select Other, you can specify rows and columns to a maximum of 8 rows and 10 columns. If the resulting numbers of cells are less than the numbers of the displayed diagrams, you get an error message. To see all diagrams, choose a layout that provides the necessary number of cells, or close one or more diagrams and choose a new layout.
Sampling parameters
Select Sampling parameters to get the Specify Sampling Parameters dialog where you can define the sampling rate and the view interval.
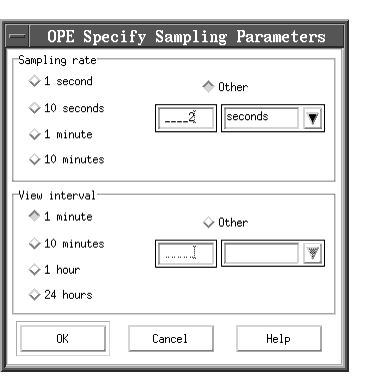
With Sampling rate you define how often the Server Monitor diagrams are refreshed and how often the Server Monitor retrieves new values for the displayed Server meters.
With View interval you define the time interval that OPE displays in the diagrams. If you change Sampling rate and View interval, OPE displays as much data as remembered from the previous view interval. The new view interval is filled with old and new values.
After a new sampling rate is defined, the following applies:
- The meters that are displayed before the new sampling rate are not changed according to the new sampling rate.
- Rates are not displayed differently because they are independent of the sampling rate. If you want to see the point in time when the sampling rate is changed, look at the width of the meter rectangle (rates) or the density of the meter bars (absolute values).
Show labels
Select Show labels to turn on and off the horizontal time axis and vertical value scale for all diagrams. For each diagram, a horizontal time axis and a vertical value scale is displayed. By default, the value scale shows the corresponding labels and the unit of the corresponding diagram. To see the value scale with tick marks, select Value scale. To see the horizontal time axis with tick marks, select Time axis. Note that OPE changes the scale of the value scale dynamically to adjust it to the currently displayed values. These automatic changes also affect the shown labels.
Centered
When you select Centered, OPE adds new Server meters to the right part of the diagram. The left part of the diagram remains static. When the diagram is filled, OPE moves it to the left, leaving one third of the diagram open, and again fills the right part of the diagram with new values. This way of drawing, which is the default value, helps you get a steady view of the diagram.
Save profile
Select this option to save the currently used settings to your personal profile.
Preferences
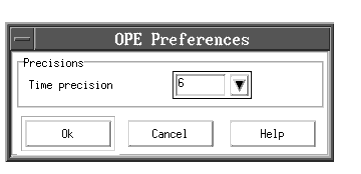
This option refers to each time indication in seconds. It displays the Preferences dialog, where you can specify the number of decimal places after the decimal point.
Thresholds
You can specify a threshold for each Server meter separately by setting a limit for the corresponding meter value. This is possible even for meters that you do not currently view. When this limit is reached, the meters in the diagrams are shown in a different color.
Thresholds must be entered with the keyboard on the appropriate specification dialogs. They cannot be set or manipulated on the meter diagrams. A threshold is shown as a horizontal line in a Server meter diagram. If the threshold´s value is out of the range of the scale, a colored 'T' will appear that shows you that a threshold is active.
For meters that can be displayed as absolute values or rates, you must specify the threshold as a rate. However, for meters that can only be displayed as absolute values, the threshold can only be specified as an absolute value. Whether the meter is displayed as a rate or as an absolute value, and also when the meter is not visible, OPE can launch a user exit. If you defined a threshold and a user exit, OPE will launch this exit when the threshold is exceeded.
Note: The number you enter as threshold value may have a decimal separator. The number format depends on the settings of your system.
Activate
You can activate or deactivate all specified thresholds at the same time by selecting Thresholds and then selecting or deselecting Activate.
Specify thresholds
When you select Thresholds and then Specify thresholds, you can choose from the options General, Clients and Logs.
The following is an example for the Specify Thresholds - Logs dialog:
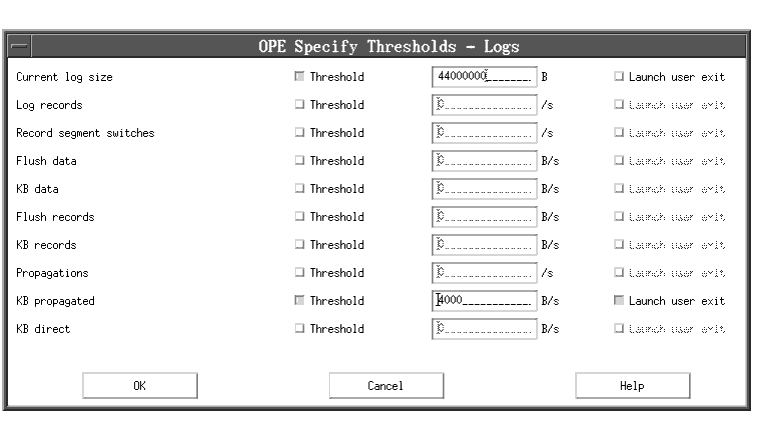
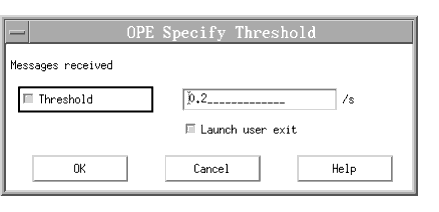
If you select the Threshold check box, the entry field for the value and the check box for the Launch user exit are enabled.
If Launch user exit is active, a colored "U" will appear in the upper left corner of the meter diagram. Note that you can activate a threshold without activating a user exit.
If you switch on the threshold for the Server meter, the value of the threshold will be stored in the profile. Also stored in the profile will be user exit information and the global threshold switch.
Specify user exit
When a threshold is exceeded, you can let OPE launch a user exit program. This program can perform any kind of action by which you want to react to the situation. A useful action could be, for example, a notification message to a system's administrator.
Select Thresholds and then Specify User exit to identify the user exit program you would like OPE to launch when a threshold is exceeded.
The launch is only done under the following conditions:
- Thresholds have been activated globally (see "Activate").
- Threshold has been defined and activated for an individual meter.
- Launch user exit has been activated for that meter (see page 145).
Note that there is only one user exit program name that you can specify for each Server Monitor. The user exit can be activated or deactivated separately from the threshold, but it is only active if the threshold is active.
When you select Thresholds and then Specify User Exit you will see the following dialog:
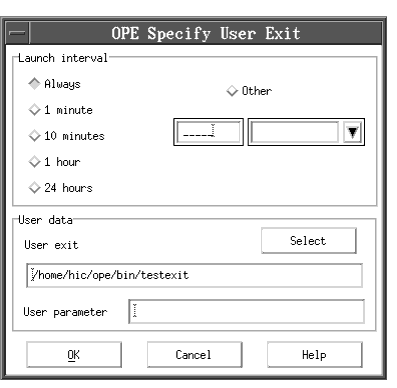
Normally you do not want the user exit to be launched every time the threshold is exceeded. Use the Launch interval box to specify a time interval for which launching is suspended after the user exit program has been started. This launch interval applies to every single meter. When the interval has elapsed, launching a user exit is activated again. Note that it is possible for a meter to start a launch interval during the time that another meter is already in a launch interval.
To set the length for a launch interval, perform one of the following options:
- Choose a predefined length (1 minute, 10 minutes, 1 hour, 24 hours).
- Choose Other and specify a time value and a time unit.
Note that if you choose Always no launch interval is in effect. That is, OPE always launches the user exit when a threshold is exceeded.
In the box User data, specify the name of the user exit program you want OPE to launch:
- Type the user exit program name into the field User exit.
You can also select a user exit with the select button.
Typically the user exit is a shell script (UNIX platforms) or a batch command file (Windows platforms).
To pass additional information to the user exit you can specify data in the User parameter field to be passed following the standard parameters that OPE passes to the user exit. Passing user-specific information can be useful for further processing in the user exit.
As already mentioned, a useful user exit could be a notification message. For example, you could launch a user exit to inform you that a threshold overflow event has occurred. With this kind of notification no overflow event will be lost.
Parameter description for sample exit:
- Date of the threshold overflow
- Time of the threshold overflow
- Server name
- Server meter
- Current value of Server meter
- Threshold value of Server meter
- User parameter(s)
The following sample user exit can be found under $OS_OPE_ROOTDIR/sample/userexit for UNIX platforms.
#!/bin/sh
#
# This is a sample user exit of the OPE Server Monitor
# threshold notification function
#
echo "Date            : " $1
echo "Time            : " $2
echo "Server name     : " $3
echo "Server meter    : " $4
echo "Current value   : " $5
echo "Threshold value : " $6
echo "User parameter  : " $7
For Windows platforms, a similar sample is found under %OS_OPE_ROOTDIR%\sample\userexit.bat.
Windows
With this menu you navigate between the windows you have opened for the active Server Monitor. To switch to a desired window, click on its name displayed as an entry in this menu.
Pop-Up Menus
Click the right mouse button to invoke a pop-up menu for diagram cells and for empty grid cells. Note that functions that you invoke for a certain diagram do not affect other diagrams.
Pop-Up Menu for Diagram Cells
Maximize
Select Maximize to fill the Server Monitor window with the diagram.
Restore
Select Restore to get the previous size of the diagram.
Range 0 to max
Select Range 0 to max to identify the absolute value of a meter. By default, all values of the view interval are displayed on the y-scale. Depending on the current meter values in the view interval, this scale is dynamically updated. To avoid having the scale change with each update, OPE changes the scale only if the value measured extends beyond the range of the current scale, or if the values become too small. By default, values from 0 to the current maximum value are displayed.
Range min to max
Select Range min to max to identify deltas of large values. Values from the current minimum to the current maximum value are displayed. The scale does not start with value 0.
Rate
Select Rate to display the values as rates. For a detailed description refer to page 129.
Absolute value
Select Absolute value to display the values as absolute values. For a detailed description refer to page 129.
Threshold
The threshold entry allows you to specify a threshold for the current meter. In contrast to the specification done with the Thresholds menu, this is a specification for a single meter.
You can resize the scale to get the current threshold on the Server meters diagram by selecting Always visible. Note that by resizing the scale to see the threshold line, the actual values of the diagram might become too small to see, especially if the threshold is much higher than the actual values.
When you select Threshold and then Specify, you see the Specify Threshold dialog where you can set the value of the threshold. You can activate it, and you can activate the launch user exit function. This dialog is similar to the Specify Thresholds dialog that you can select from the menu bar.
For general information about thresholds see Thresholds.
Close
Select Close to close a diagram and display an empty grid cell. Note that all settings for this diagram are lost when you reopen it later.
Pop-Up Menu for Empty Cells
New Server meters
Select New server meters to get the Select Server Meters dialog, where you can select general, client, and log meters.
The number of cells available to display a new meter depends on which cell your mouse cursor is on when you invoke the pop-up menu. Only the free cells that follow the cell on which you click are considered to be part of the pool of free cells. The cells that precede the cell on which you click are not considered. This behavior is different from using the New Server Meter entry in the Options menu where, starting with cell 1 in line 1, all free cells are considered to belong to the free cell pool.


